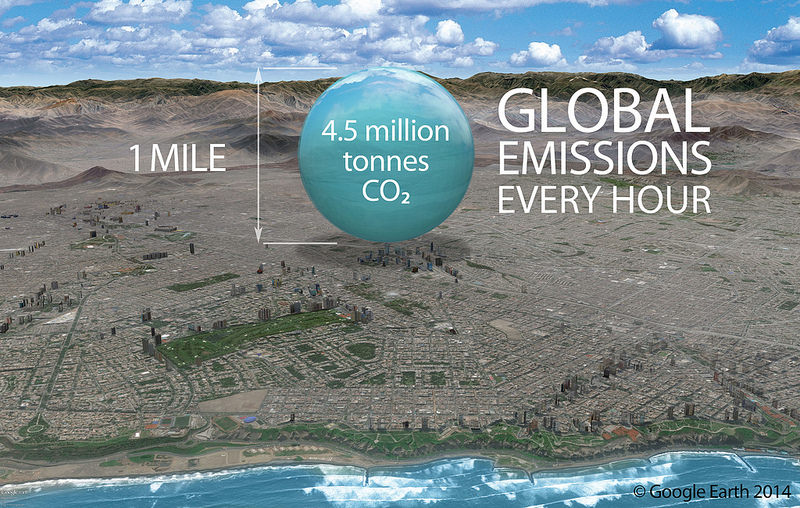
 Since 1880, the average global temperature has risen in direct relation to atmospheric carbon dioxide emissions. Of the top 20 carbon dioxide emissions producing countries, China and the United States top the list. These are facts.
Children learn to distinguish the difference between fact and opinion at an early age. Preschool teachers use literature to help children discriminate between what is real and what is fantasy. Unfortunately as we age, politics begins to influence our faith in facts, especially when it comes to climate change.
A fact is defined as “something that actually exists; reality; truth; known by actual experience or observation”.((http://dictionary.reference.com/browse/fact)) Facts can be proven. There is data and evidence to support them.
 We were recently sent The World Almanac and Book of Facts 2016
The World Almanac® and Book of Facts is America’s top-selling reference book of all time, with more than 82 million copies sold. Since 1868, this compendium of information has been theauthoritative source for all your entertainment, reference, and learning needs.
Top 20 Nations Producing Carbon Dioxide Emissions, 1990-2012
- China
- United States
- India
- Russia
- Japan
- Germany
- South Korea
- Iran
- Saudi Arabia
- Canada
- Brazil
- United Kingdom
- South Africa
- Indonesia
- Mexico
- Australia
- Italy
- France
- Spain
- Taiwan
Although this list in interesting in itself, what is the most scary fact about it is the percent of change.
 From 1980-2012, China’s carbon dioxide emissions have risen 460%. India’s CO2 increase was even greater at 529%. For this same time period, the US CO2 emissions have risen 10%.
These numbers show the growth of fossil fuel consumption in these countries, as major source of carbon dioxide emissions according to the The World Almanac and Book of Facts 2016.
What is encouraging is to see the percentage of growth is reduced when looking at more recent years from 1990-2012.
- China 257% (compared to 460%)
- US 5% (compared to 10%)
- India 216% (compared to 529%)
When you consider the size of the populations of India and China compared to the US, the statistics speak loudly to the fact that our western lifestyles are the major source of carbon dioxide emissions, but it doesn’t have to be. Per capita data is more reflective of lifestyle.
The United Kingdom, Italy, and France actually showed a reduction to negative percentage growth in carbon emissions over this same time span.
 On the heals the of the landmark Paris Climate Deal, which may be not strong enough but is at least is a start, these facts show the possibilities. In order to keep global temperatures from rising above 2 degrees C, countries should “reach global peaking of greenhouse gas emissions as soon as possible, recognizing that peaking will take longer for developing country parties, and to undertake rapid reductions thereafter.”((http://www.nytimes.com/interactive/projects/cp/climate/2015-paris-climate-talks/key-points-of-the-final-paris-climate-draft)) Hopefully the top 20 countries with the greatest carbon dioxide emissions have reached this peak; however, the number of developing countries included means this hope is probably not realistic.
There are many other facts contained in the The World Almanac and Book of Facts 2016 that affect climate change. From population statistics to natural disasters, the evidence of climate change is supported by facts not opinions.
Photo credit: 350.org via Foter.com / CC BY-NC-SA
Photo credit: Carbon Visuals via Foter.com / CC BY
Photo credit: Carbon Visuals via Foter.com / CC BY
Global economy is ruined. V-shaped recovery is a myth. Same for U-shaped one… I think that this economic collapsed will affect climate goals and governments will turn back to fosil fuels, ruining the world faster than ever.